

Thank you very much for the introduction.
I’m very excited to be here listening to all the urban perspectives. I’m trained in engineering, but my whole career has been integrating different aspects. Recently, I’ve been focusing on data science, finance, engineering, and also social science.
In my lab, the Climate Energy and Risk Analytics lab, we are working very closely with the New York City Mayor’s Office on different types of data-driven solutions for various climate risk management.
To do that, we integrate different aspects: data science, climate science, engineering, operations management, but also stakeholder and community engagement for very practical solutions.
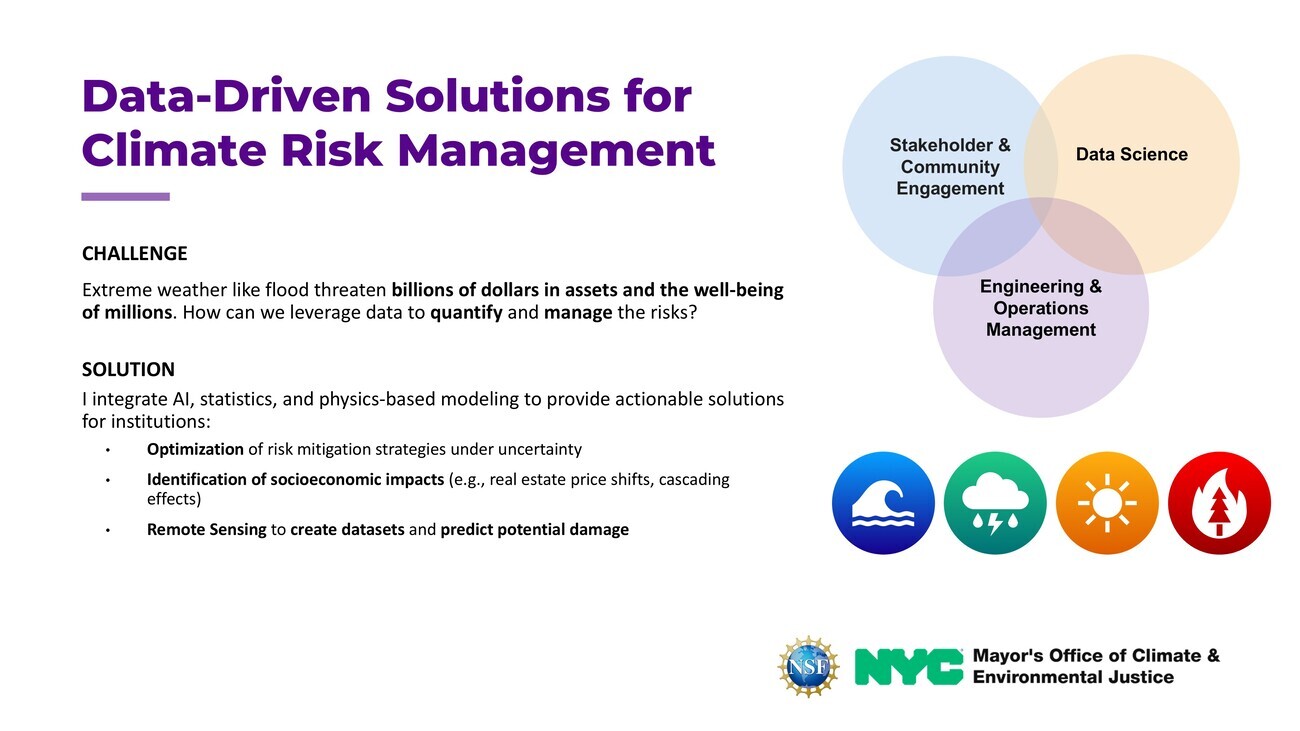
In New York, we are facing coastal flooding. Now we also have a drought, and we even had a wildfire. Nobody really thought that would happen in New York. So we’ve been talking about a lot of challenges, and those are causing billions of dollars in losses and also impacting a lot of people’s lives.
I wanted to focus more on the solution side today: what we are trying to do.
Let’s start with optimization of risk mitigation. There are so many things you can do. Maybe you can build coastal seawalls, maybe you can make elevated parks for coastal flooding. But how do we know which one to really choose? It’s a really complex question because it’s under deep uncertainty. Nobody really knows what is going to happen in terms of climate, in terms of mobility. So we work on the optimization of different types of solutions.
We also work on the identification of socio-economic impacts, and that includes real estate price shifts before and after different types of hazards, including coastal flooding. We are also working on how different types of strategies could impact those real estate prices.
An important one is also the cascading effects. For example, if utility or energy sectors are impacted by flooding, then it’s easy to imagine what is going to happen in other sectors that could be residents, that could also be a hospital, or emergency management. A lot of them are relying on each other. So we’ve been working on all these topics.
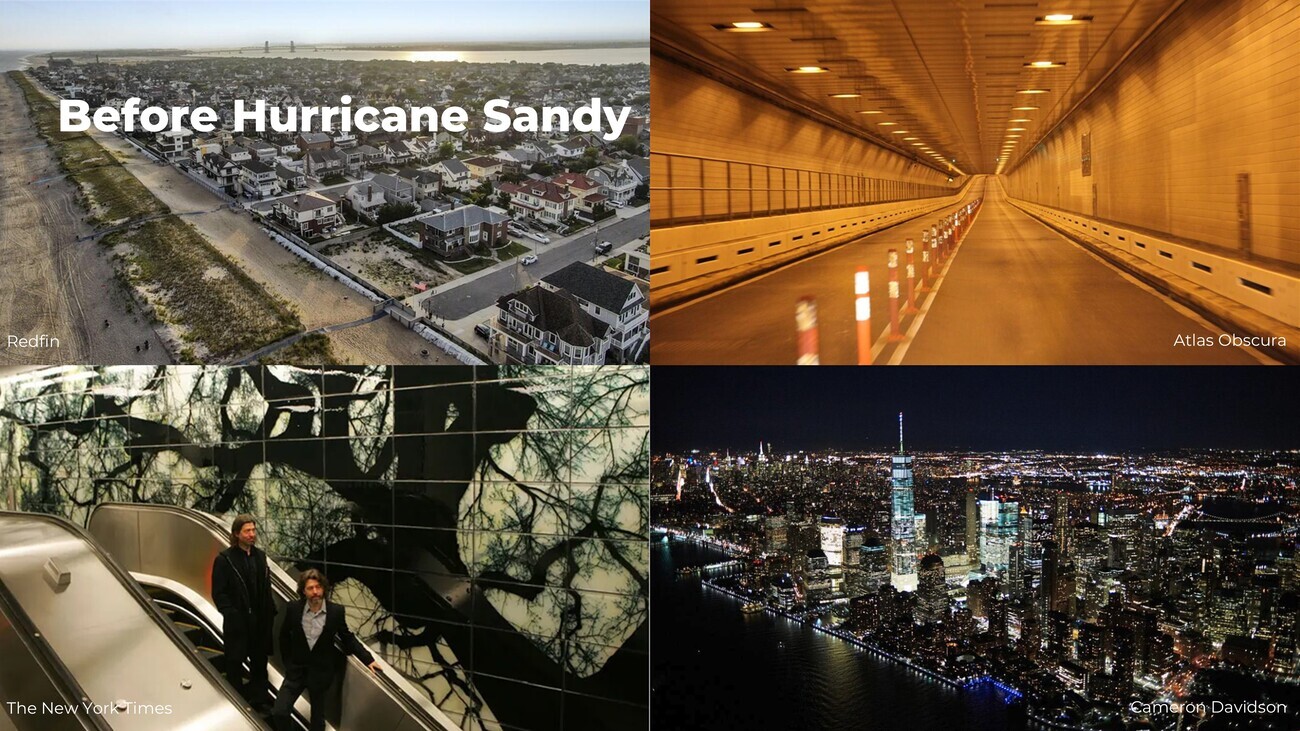
Since I came here as a New York person today, I wanted to share with you a couple of pictures of New York. The top left is Rockaway, which is outside of the Manhattan area. It’s a barrier island facing the Atlantic Ocean. There are a lot of single-family houses. And then we have a tunnel that connects Manhattan and New Jersey. On the bottom left, we have subway stations that are located at the tip of Manhattan. This one is South Ferry Station, and the picture was taken at its inauguration in 2011. The last picture is the aerial view of Manhattan skyscrapers at night. You can see a lot of lights. The World Trade Center is the tall one.
So what happened in all these locations in 2012? * Rockaway: their single-family houses were destroyed by storm surge as they faced the coast. * And then the tunnel: there are multiple tunnels looking like this, but they were all inundated with salt water. So it took a really long time to be restored. * South Ferry Station: that was brand new in less than a year. It was completely devastated. MTA, the subway organization, needed to reconstruct the entire subway station. * And then the last picture is Lower Manhattan. It looks like Lower Manhattan is gone, because of a power outage.
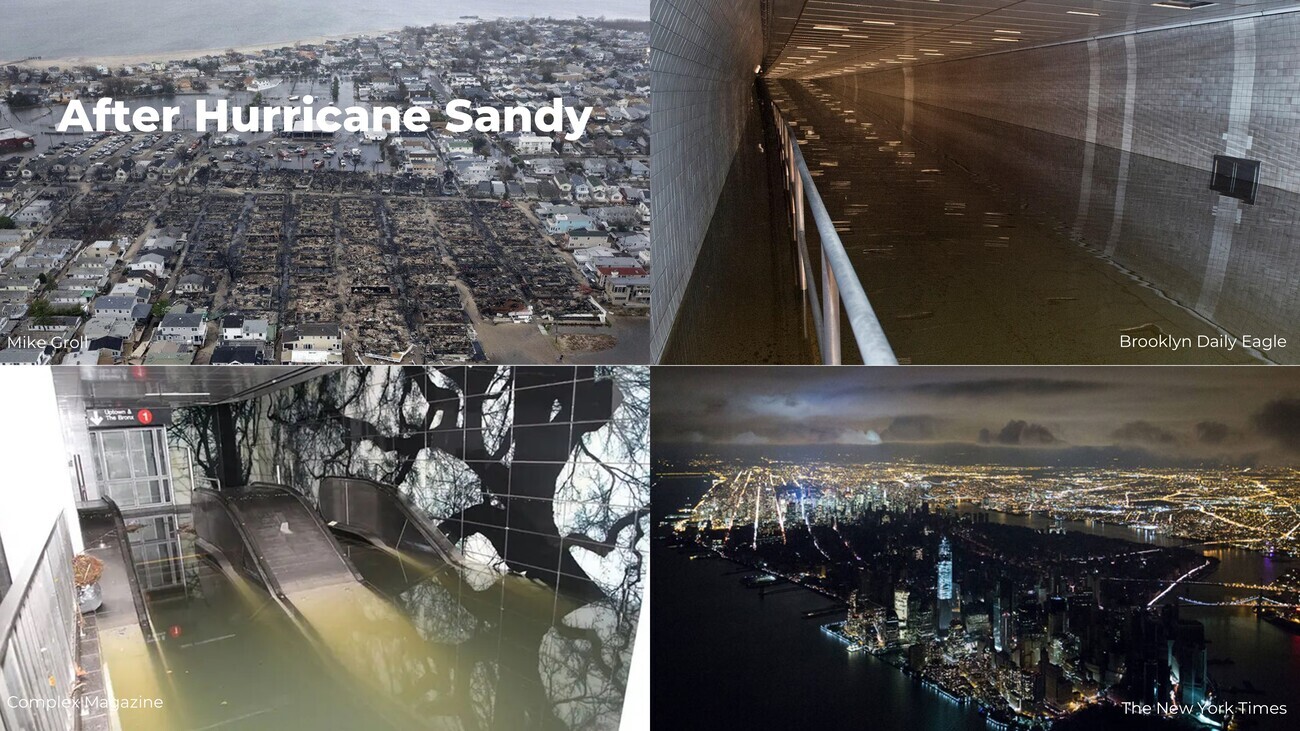
That was just coastal flooding. But New York City is facing different types of flood risks.
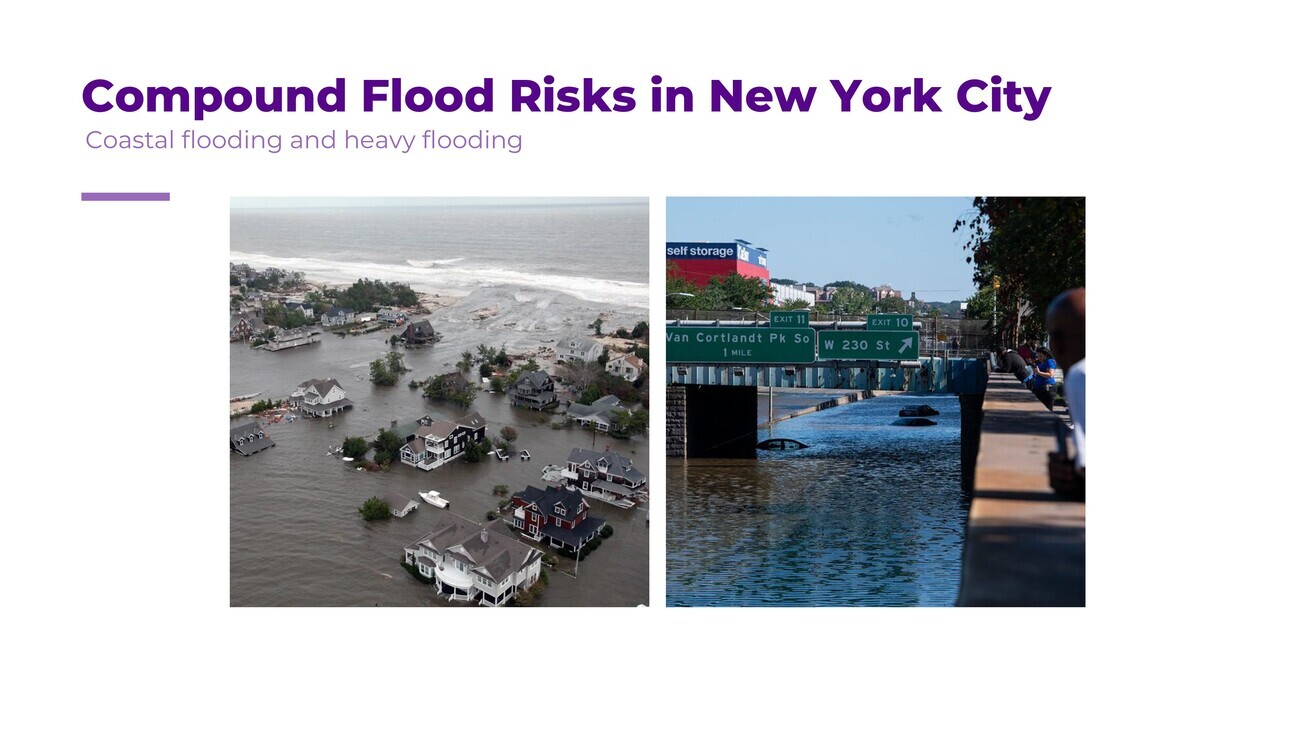
You have a coastal flooding picture on the left side. The right side is a different one: heavy rain-induced flooding. And those could happen simultaneously or one after another, which could also cause compound flooding, which is way worse than just having one. So the area impacted is going to be different. Naturally, coastal flooding should impact the coastal areas. But with heavy rain, the inland is also going to be impacted.
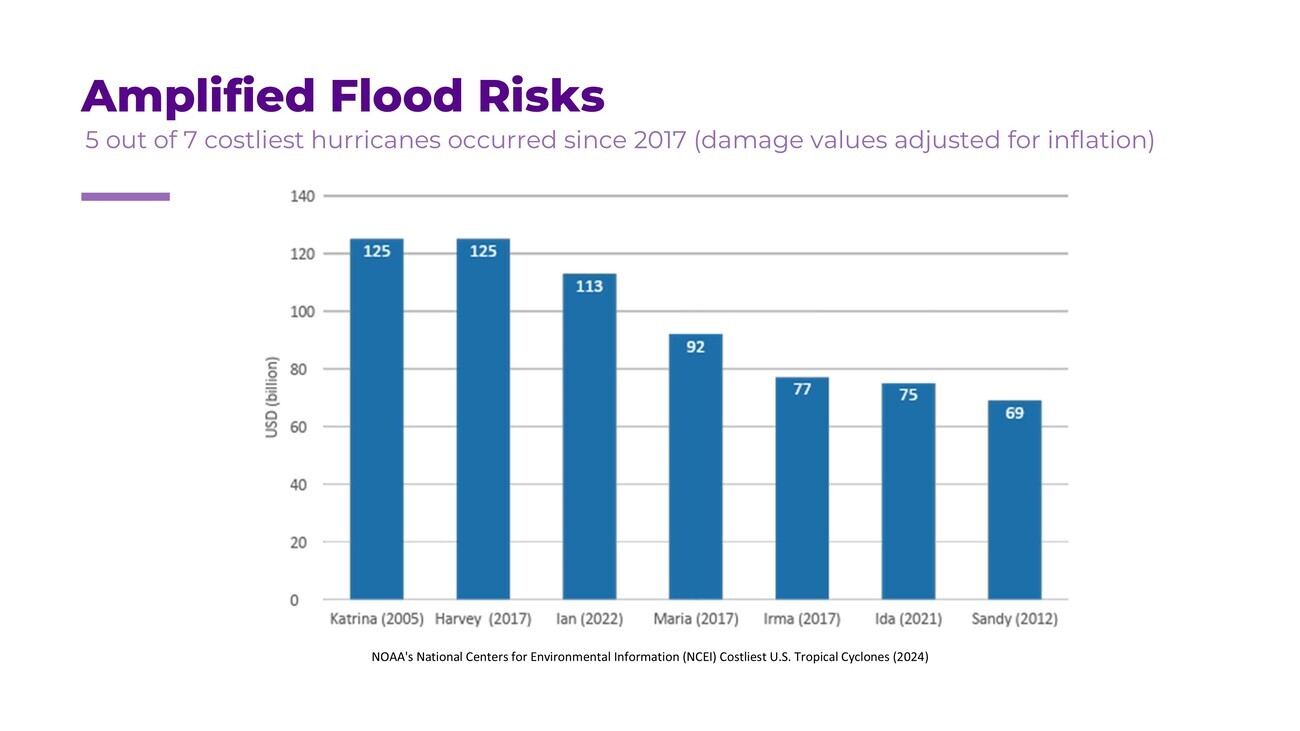
Here is a list of the costliest hurricanes in the history of the US, and a seven-bar chart of different types of hurricane names. You might be familiar with some of them. Katrina (2005) has still been the costliest, but it has now been topped by Harvey, which happened in 2017. Five out of seven hurricanes in this list have actually happened since 2017. So it’s been really recent, despite the history that covers a really long time.
I always get this question, whether it’s because of just inflation, but it’s not really the case. This simply shows that hurricanes are just getting more disruptive and are also amplified by climate change.
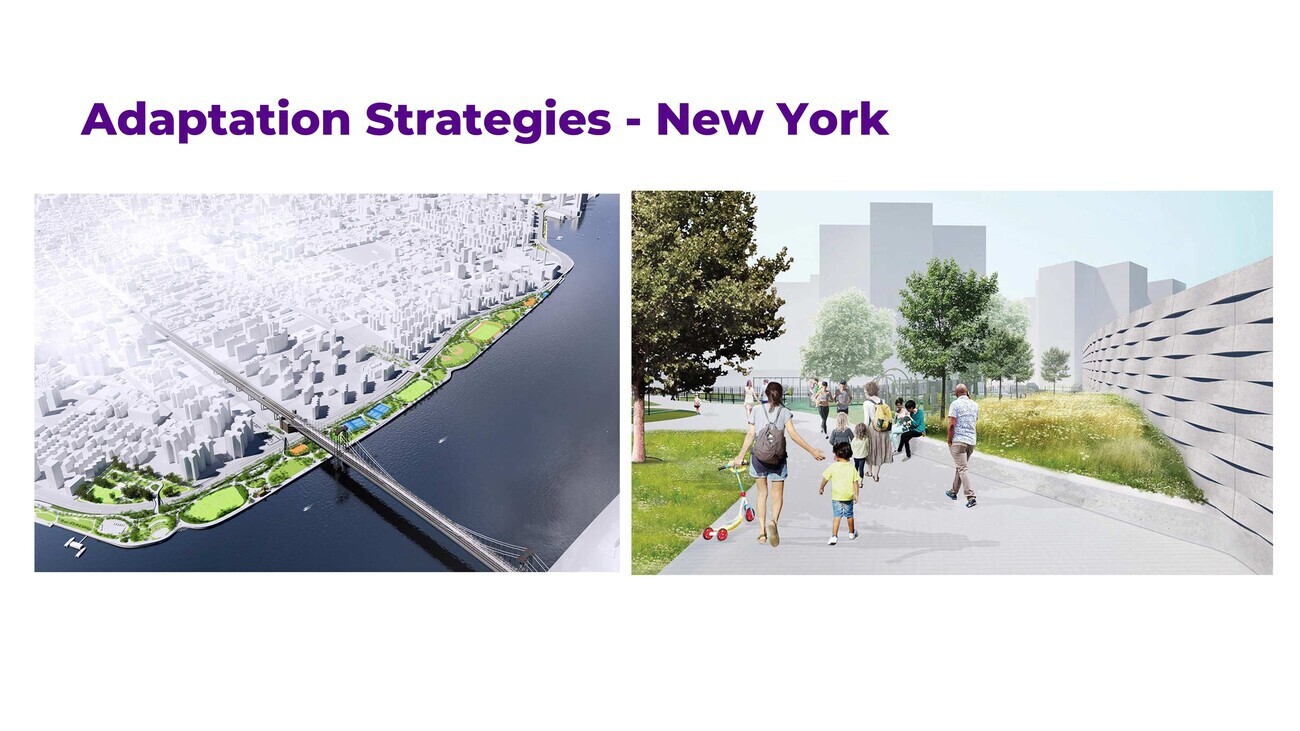
What has been done in New York City after all these threats? The big example is the Lower East Side Coastal Resiliency Project. This project is covering the Lower East Side of Manhattan, elevating the entire area and also building some seawalls. It’s a combination. On the right side, we have seawalls, which are about five meters. On the left side picture, the green area is a park elevated by about five meters. This area has always been at a really high risk with a vulnerable community as well, right next to this area. This project was started and completed recently. So if you ever happen to go to New York, it would be great to go check out this park.
There are also multiple coastal resiliency projects happening in the city, including Red Hook, Hoboken, and Staten Island. All of these are very different. Some of them are parks, some of them are adding more green space, and some of them are more like really building seawalls. So these are quite different types of sites, and the teams have been trying to determine what solutions make sense in the local context.
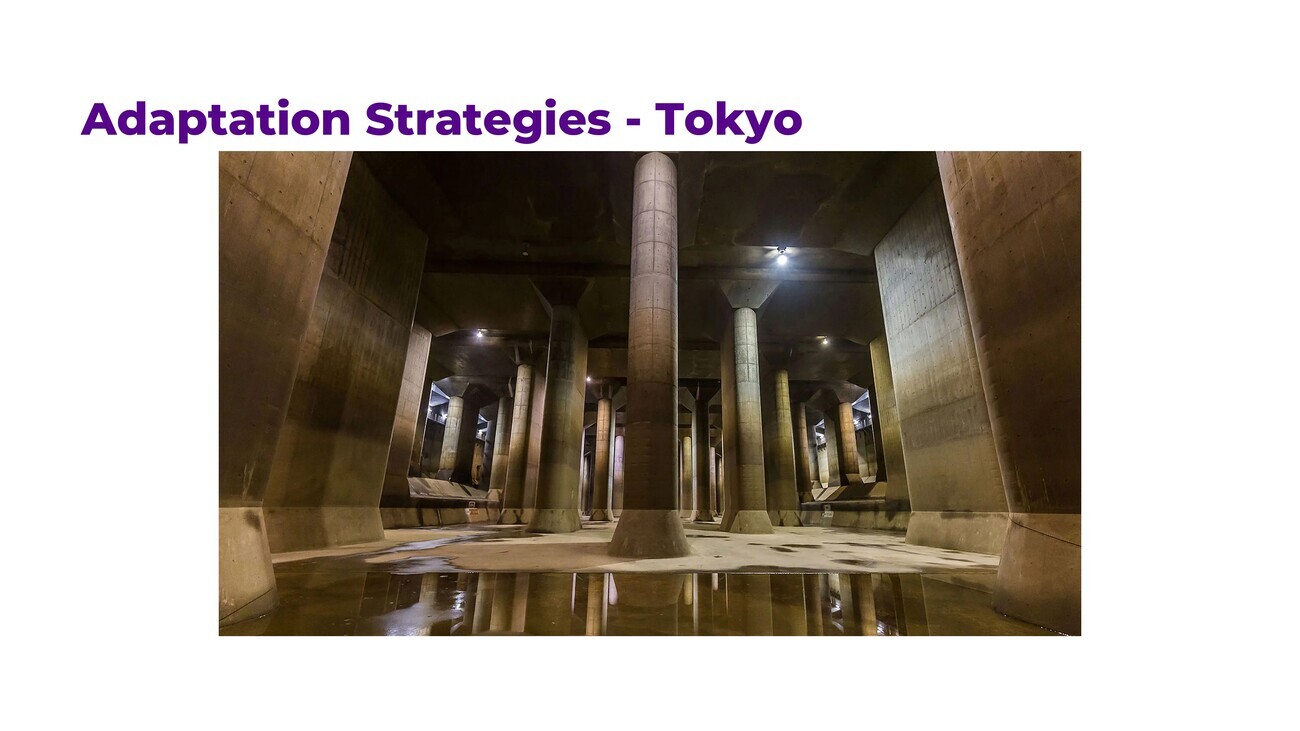
Since I’m originally from Tokyo, I wanted to show how each city has its own unique way of dealing with things. Tokyo has this massive underground water tank — it’s like a cathedral beneath the city. If there is heavy rain, all the water is going to be taken into this area underground, so that it’s not going to impact the drainage system. This is a really great idea. Nagoya City, which is also a big city in Japan, installed something like this, and they reported that there is a significant reduction in flooding overwhelming all these drainage systems.
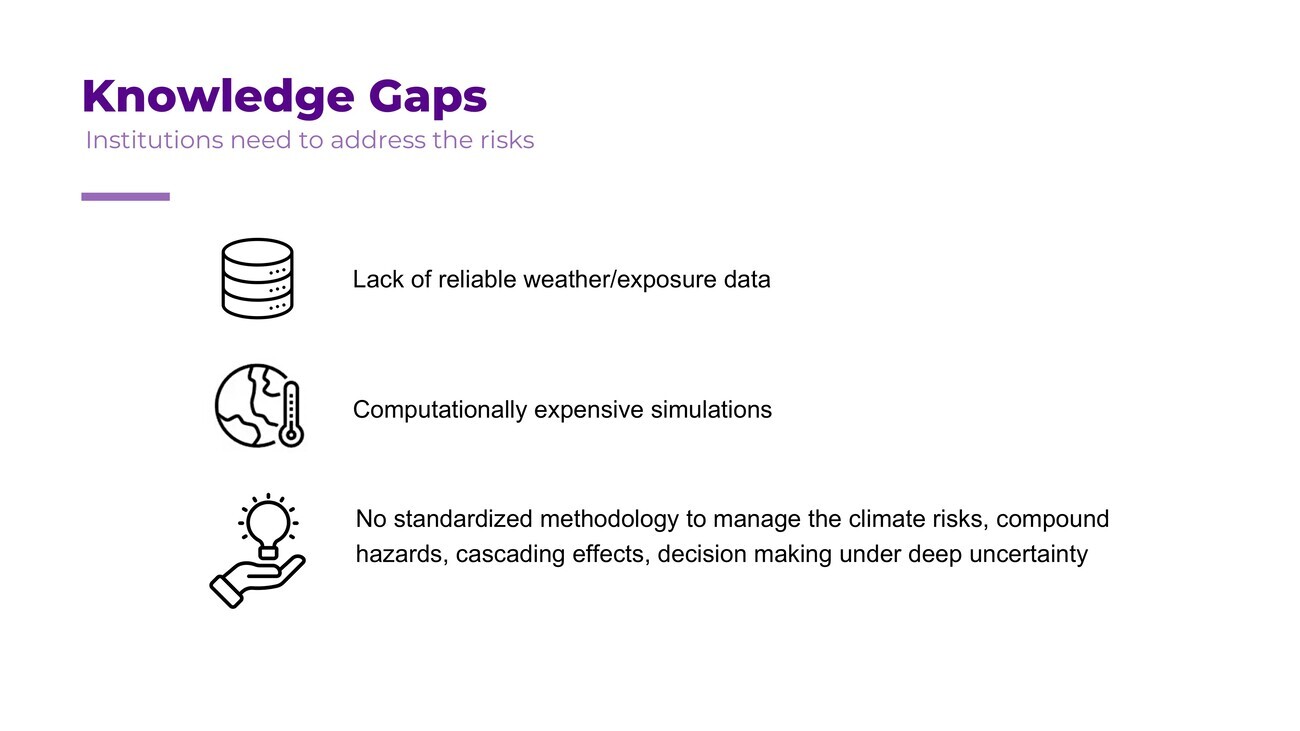
I just wanted to touch on some of the knowledge gaps. We know there are many things we can do — and yes, it’s discouraging to see all those images — but there’s actually a lot we can achieve. It’s just that a few obstacles or hiccups get in the way.
- The first one is a lack of reliable weather and also exposure data.
- Another is computationally expensive simulations. When we run flooding or different hazards, it just costs a lot and takes a lot of time.
- The last one: At the moment, there’s no standardized methodology for managing climate risks, such as flooding — no consistent framework to guide decisions about how and where to invest limited resources, or which solutions to prioritize.
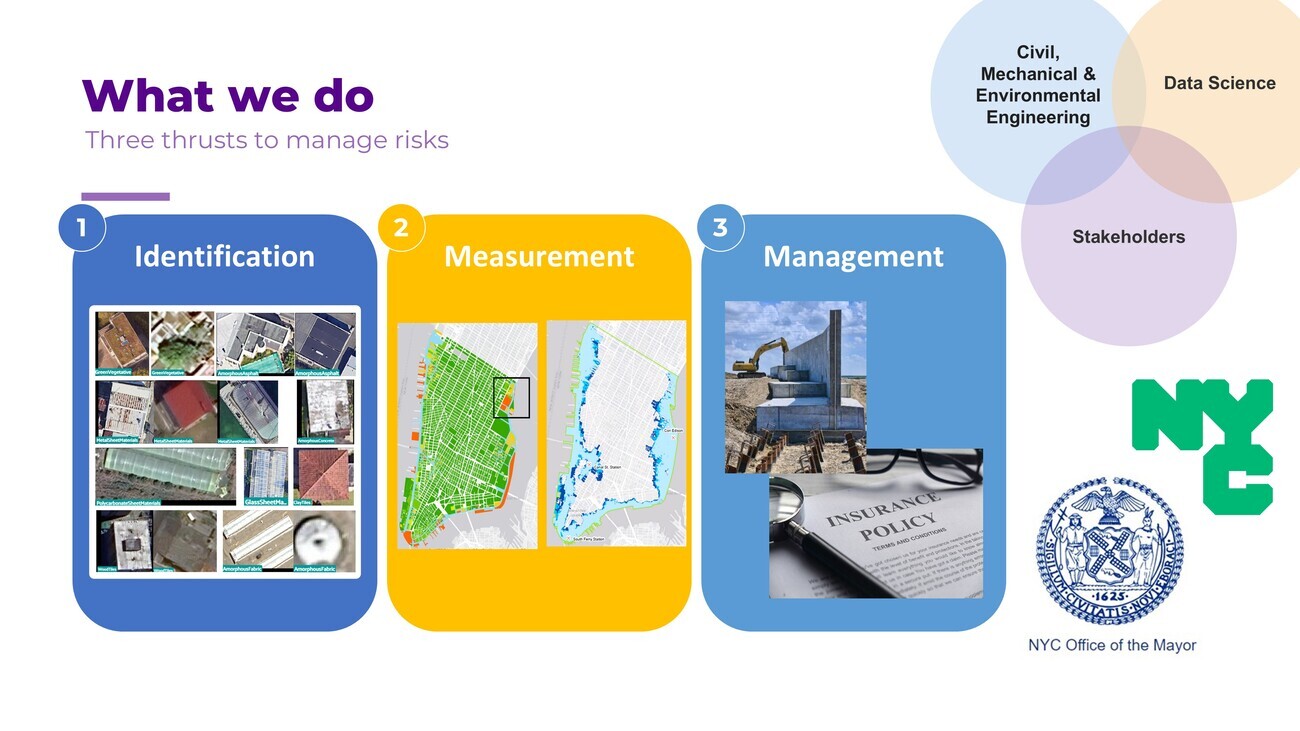
So, here’s how we’re addressing these questions — we’ve broken them down into three key directions:
- The first one is Identification. We really need to know what exactly the risk is in that region, and that’s going to be very regional. We identify the risk, maybe from different types of building materials, so that we know what is going to possibly happen to those buildings. And we create a data set—it’s publicly available in case you’re interested.
- Number two, Measurement. Once you identify there might be some risks, you want to quantify what exactly they are. And so we calculate how much damage is going to impact the infrastructure, houses, and the residents, by computing flood areas and also cascading impacts.
- The last part is Management. Once you identify what kind of impacts are going to be made, then you want to figure out what to do. I’m going to talk a little bit more about this management part.
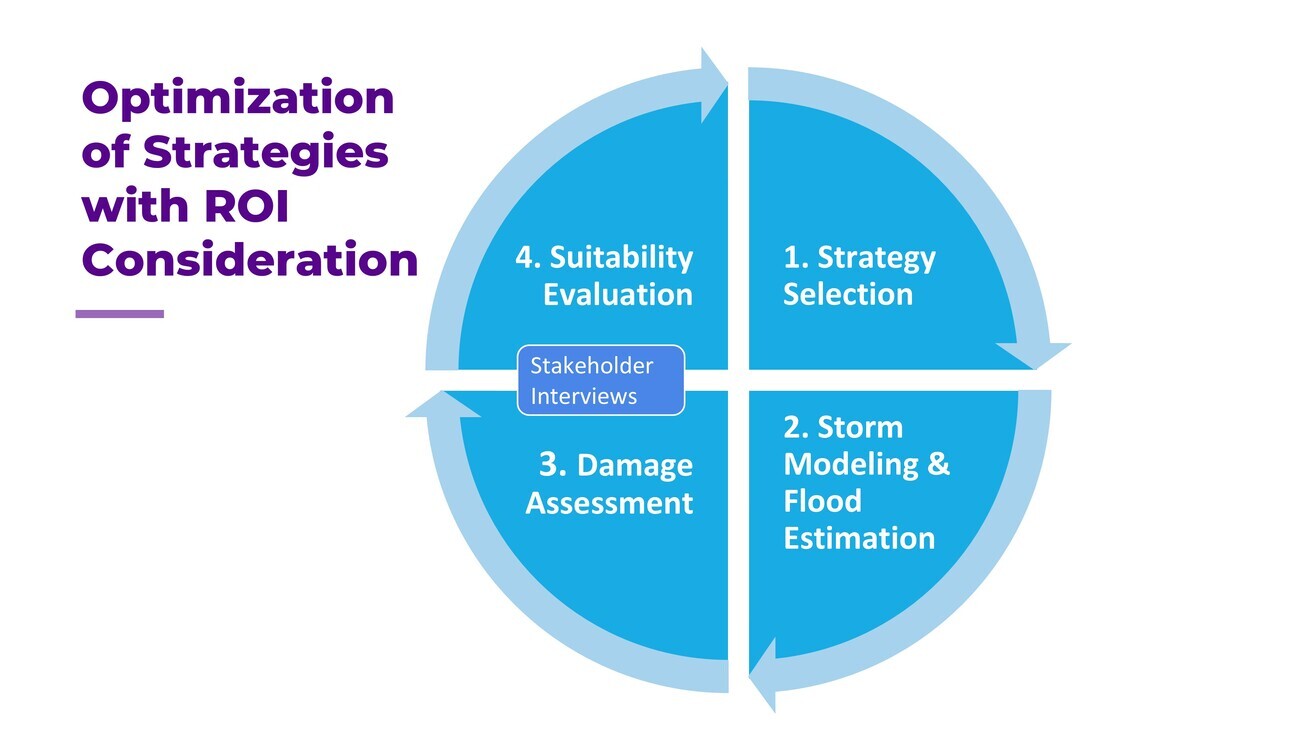
This is the framework I developed for coastal flooding.
What it does is: you pick potential strategies that you are considering with some limitations and constraints. Then we calculate possible future storms and flooding in the area for the next hundred years or any duration—all these possible uncertainties. And then we calculate expected damage. Based on those results, we also talk to stakeholders so that we are not choosing some nonsensical solutions that nobody wants. We talk to policy makers and residents who live there so that people are not going to be on strike.
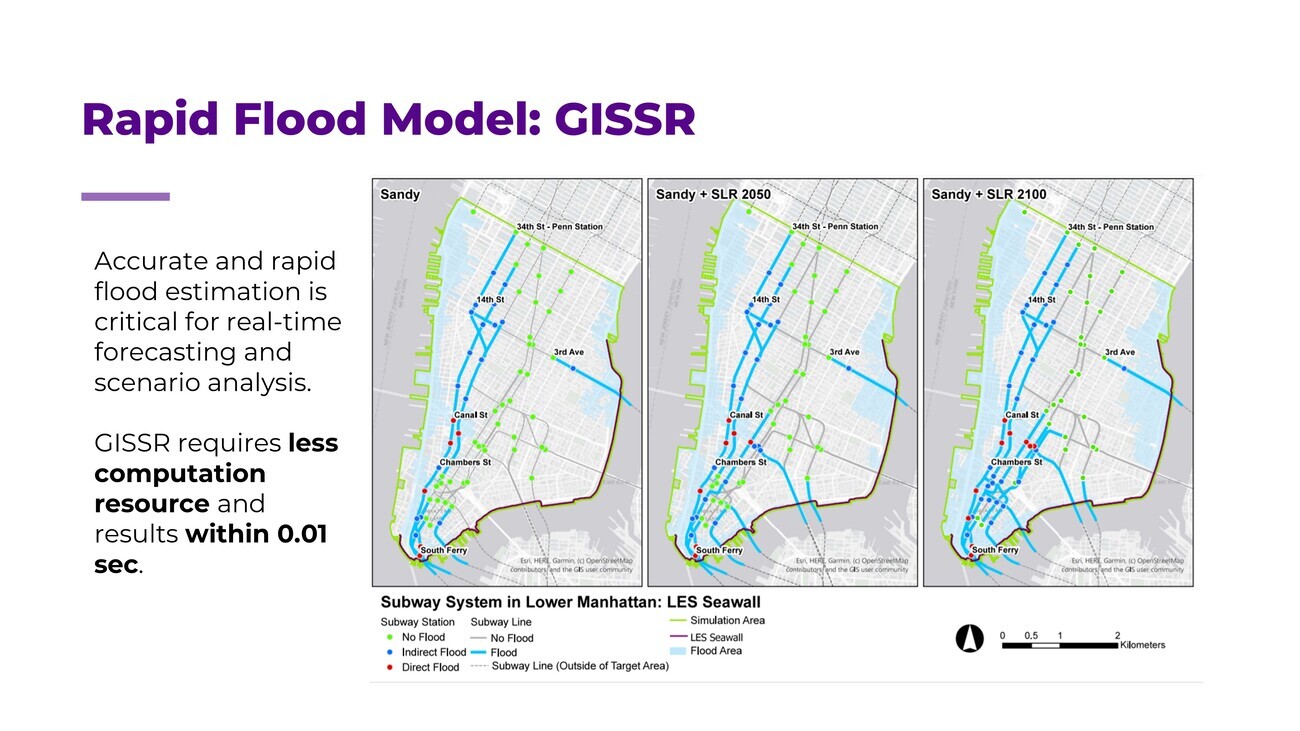
We have a “rapid flood” model, which essentially tells you in real-time which area is going to be flooded, which subway station and tunnels are going to be flooded, and all that within seconds. Regular flood simulation takes hours or days. This one gives you a lot of opportunities to run different types of scenarios for a long duration.
This is also part of the management side, but I realized that when talking with communities, they often don’t respond well to statistics — things like return periods and so on. So, I started working on this visualization: it’s a 3D interactive tool available on a website. You can access it through the QR code and explore it yourself in the New York setting.
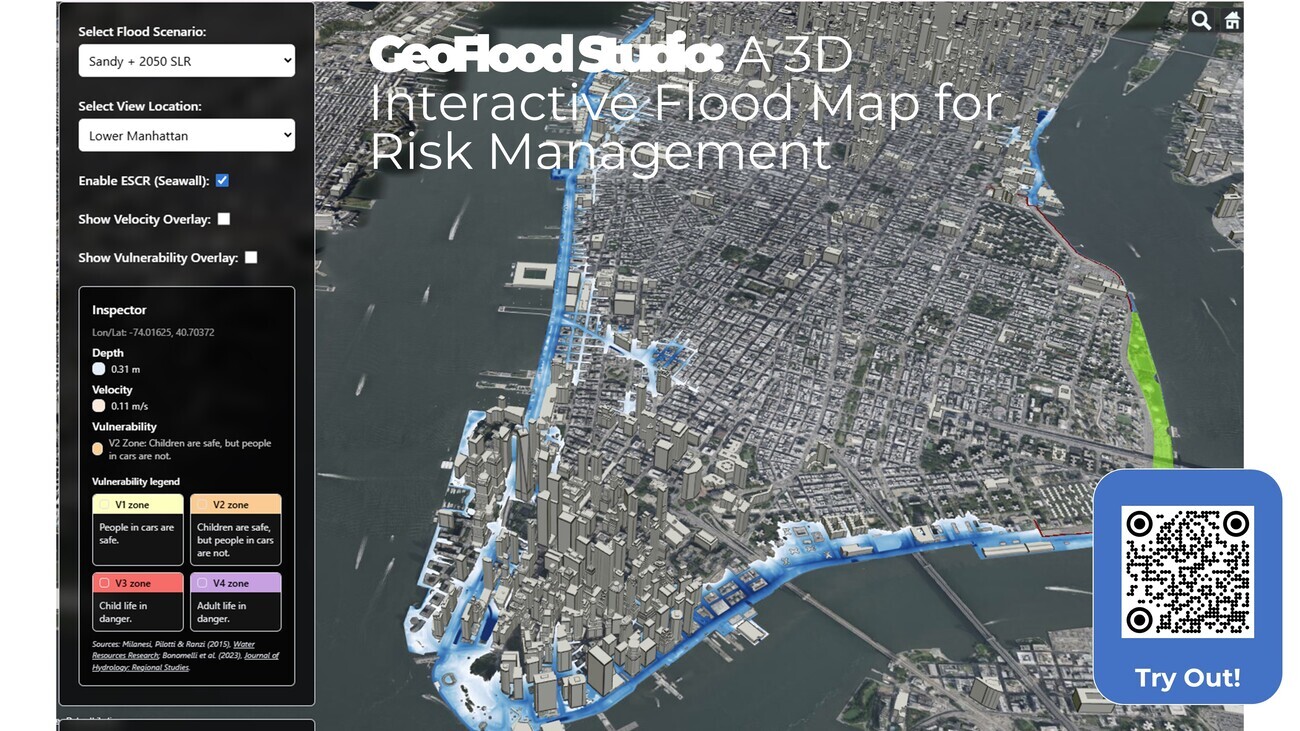
You can pick a location to see the flood depths, flood velocity, and also if it’s actually dangerous or not to be in that spot. We can tell you, “this zone, you might be okay if you are in the car, or you might not be really okay, especially if you have children and something like this”. We also have a human silhouette—which I can’t show you here—that allows you to change its height to easily visualize just how deep the water is. We’re developing this in collaboration with the city and the community, including local high school students, to help make the information more understandable and accessible to everyone.
So here are a few of the key takeaways I mentioned — our work focuses on identification, measurement, and management. A lot is happening in my lab, and I’m really excited to be here and to keep the conversation going.
Thank you very much.
Réutilisation
Citation
@inproceedings{miura2025,
  author = {Miura, Yuki},
  publisher = {Sciences Po Rennes \& Villes Vivantes},
  title = {Modélisation et politique de réduction des risques littoraux
    à Tokyo et New-York},
  date = {2025-09-18},
  url = {https://papers.organiccities.co/modelisation-et-politique-de-reduction-des-risques-littoraux-a-tokyo-et-new-york.html},
  langid = {fr}
}